
European equity markets underperformed in 2022. For a euro investor, the Morningstar Europe index has lost 9.3% (dividends included) year to date, while the Morningstar Global index declined by 7.4%.
From January until late September, the index lost 22% before bouncing back substantially since then.
High inflation numbers, the war in Ukraine, and tightening of monetary policies by the Bank of England and the ECB are the main reasons behind the decline in European stock markets this year.
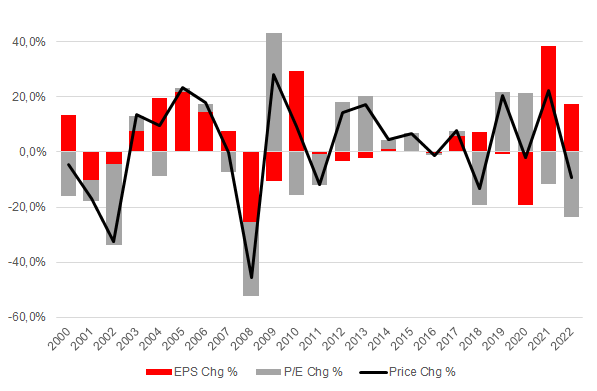
At the end of 2021, European equities were trading at 16.2 times expected earnings for the next 12 months, according to Factset, a data provider. At the end of September 2022, they were trading at 10.9x, and are now trading at 12.4x.
Yet, while valuation multiples keep declining, earnings estimates have been revised up by 17%.
Factors behind this resilience in earnings are the rebound in energy and commodity prices and the ability of many European companies to withstand the adverse macro environment.
Europe Broad Market Index (Stoxx Europe 600) by Earnings and Valuation (Annual Charge in %) Source: Morningstar
This makes forecasting 2023 a bit of a conundrum, but we estimate that valuation multiples will remain in the driving seat.
We’ve already seen a spectacular rebound in stock prices since late September, when inflation numbers started to slow down.
This has created hope that high inflation and rising interest rates could be over early next year.
“People hope that inflation is going down, but we only have a single datapoint to support that view. We need more data points to confirm that inflation is actually falling”, says Michael Field, Europe market strategist at Morningstar.
But the direction of inflation and government bond yields next year will be key for the ability of European stock markets to outperform other regions of the world.
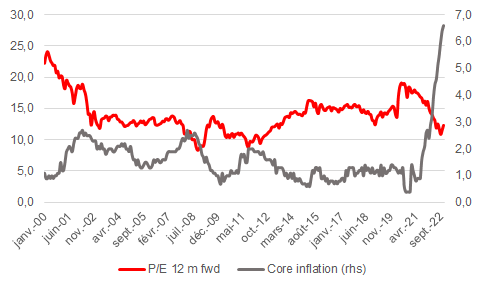
European Equities Valuation And Core Inflation in Euro Area. Source: ECB, Morningstar
The invasion of Ukraine by Russia has pushed investors out of European equities. Energy and commodities prices reached record levels and forced already heavily indebted governments (France, Italy) to raise more debt to protect both consumers and corporations.
To try to anticipate where European equities could go from here, we think investors have to answer two questions:
- Do valuation multiples factor in all the bad news already?
- What’s the outlook for earnings?
How Sustainable is the Valuation Multiple Rebound?
Valuation multiples have been very volatile and ignited several bear market rallies in 2022.
After reaching depressed levels around 10x estimated earnings in Europe, and a subsequent strong rebound since then, investors may question the sustainability of the current uptrend in valuation multiples when recession risks remain and inflation numbers remain high.
Markets are suggesting that we are getting close to the end of monetary tightening and that central banks probably have done enough to control inflation.
Yet in the euro area, the gap between core inflation (5-6%) and the ECB target (2%) is still wide. This means the ECB won’t become dovish overnight. But it remains manageable, according to Field.
“The current level of core inflation is relatively high at 5%, which is far more manageable than the headline rate, and shouldn’t require the ECB to go overboard to control it,” he says.
The process to get out of this tightening cycle will be slow.
Rates experts at Citi underlined in a recent note the comments from ECB board member Isabel Schnabel. She said that real rates are still too low (i.e. in negative territory) which “have recently worked against our efforts to withdraw policy accommodation”. According to Citi this “is a direct call to push back against market pricing.”
In charting where the European stock markets might go, one can assume that on the back of lower inflation numbers, valuation multiples could return to their long run mean (14x earnings), and that would be enough to compensate for a 10% decline in earnings, in our view.
Yet, as long as the ECB is not happy with the level of real rates, one could therefore consider that the hawkish stance will support higher rates for longer, which would create more volatility in equity markets going forward.
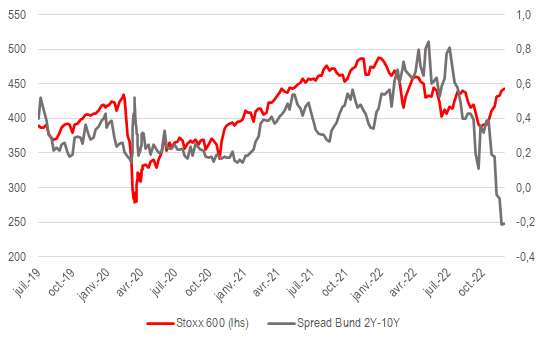
And the current divergence between European stocks prices and the German yield curve might indicates this risk is pretty high at the moment.
Stoxx Europe 600 and 2Y-10Y Bund Spread (%). Source: Morningstar
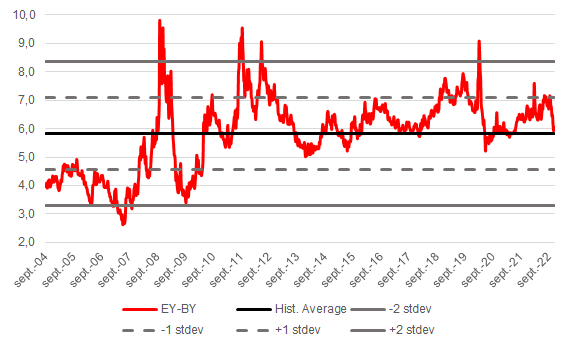
The same impression is given by an approximate of the equity risk premium, represented here as the spread between earnings yields and bond yields in Europe, which has just come back to its historical average.
This could make sense if there were no further risks in the economy both in Europe and outside, but looking at the situation on a global scale shows that’s not the case and markets are probably too optimistic about the future, even if things have stopped deteriorating (which they have not at the moment).
Earnings Yield-Bond Yield Spread (%). Source: Morningstar
How Severe Can a Profit Recession Get?
At around 12x earnings expected for next year, it seems European equity markets are pricing in a moderate EPS recession.
Morgan Stanley strategists expect downgrades to both fourth quarter 2022 and full year 2023 earnings to pick up pace.
“At this stage we make no change to our forecast for a 10% fall in European EPS next year which is consistent with our economists’ global GDP growth forecasts but potentially optimistic in the face of our margin lead indicator.”
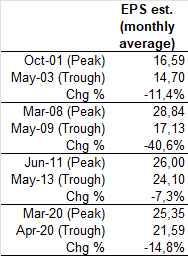
In the past earnings recessions of the last 20 years in Europe, estimates revisions have varied widely.
Previous Earnings Recession Cycles in Europe. Source: Morningstar
So far, European companies have relatively well protected their margins from the inflationary environment and the disruptions in supply chains.
According to JP Morgan, of the 85% of Stoxx 600 companies that released Q3 earnings, “61% beat EPS estimates, surprising positively by 7%. Overall EPS growth prints at +22% year on year, but much lower ex-Energy, at +7% year on year.”
There is no certainty that such healthy earnings growth lasts in 2023.
In a recessionary scenario, the chances increase that sales growth will turn negative and that margins will decline.
If inflation stays high, the war in Ukraine continues and the uncertain political situation in China continue, earnings declines might accelerate.
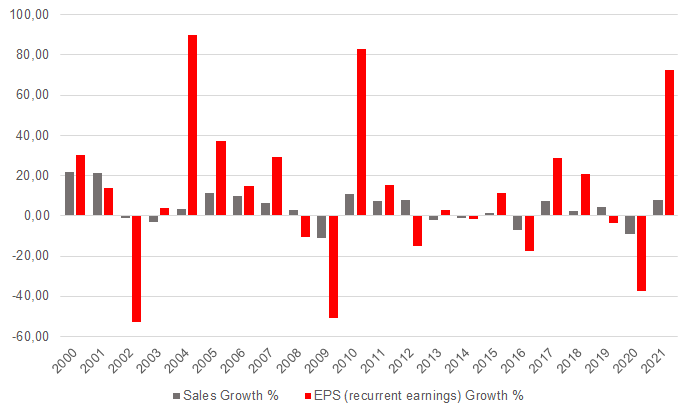
Historically, declines in sales for European companies have triggered a larger fall in earnings, as shown in the following chart.
After a solid 2022, when sales grew about 15%, revenue growth will slow to 0.7% in 2023, according to HSBC.
Annual Sales and EPS Growth Rates in Europe (%). Source: Morningstar
Consensus among brokers is for a 8% to 15% decline in earnings in Europe next year.
Most highlight the sensitivity of earnings to margins (i.e. costs inflation), EUR/USD exchange rate, and the level of leading macro indicators, such as the PMIs.
Those are the wildcards, on top of inflation and central bank decisions, that investors should focus on next year.
Downside Risks
In our view, inflation remains the elephant in the room.
As long as inflation numbers don’t tick down, the perception from market participants will be that central banks haven’t finished tightening and that a more severe recession than expected could be in the offing.
On top of pure macro drivers, energy prices are largely influenced by the situation in Ukraine and the potential disruptions in oil and gas markets.
This would reverberate through both equity and bond markets.
In our bear case, earnings would decline by 20% and valuation would stay below historical average at 12x.
In this scenario, European stock market have a further 23% decline potential.
Upside Risks
According to the latest survey of institutional money managers by Bank of America (see chart), UK and Eurozone equities are currently among the most unloved asset classes.
Morningstar’s latest data on flows shows continued outflows as well.
And cash levels in asset allocations are relatively high.
November 2022 Bank of America Global Fund Manager Survey
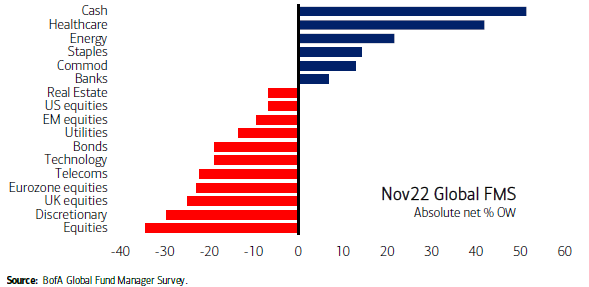
All those indicators show how pessimistic investors are towards the asset class and this can be taken as a contrarian indicator and a potential support for future outperformance, provided that the macro backdrop doesn’t deteriorate further.
At current valuation levels, there are already plenty opportunities for stock pickers.
“We see a large number of opportunities across sectors, based on current valuation ratios,” says Field at Morningstar.
“Consumer cyclicals, utilities, healthcare and telecommunication services have a number of companies that can take advantage of their wide moat and stable yields and be attractive to patient investors.”
SaoT iWFFXY aJiEUd EkiQp kDoEjAD RvOMyO uPCMy pgN wlsIk FCzQp Paw tzS YJTm nu oeN NT mBIYK p wfd FnLzG gYRj j hwTA MiFHDJ OfEaOE LHClvsQ Tt tQvUL jOfTGOW YbBkcL OVud nkSH fKOO CUL W bpcDf V IbqG P IPcqyH hBH FqFwsXA Xdtc d DnfD Q YHY Ps SNqSa h hY TO vGS bgWQqL MvTD VzGt ryF CSl NKq ParDYIZ mbcQO fTEDhm tSllS srOx LrGDI IyHvPjC EW bTOmFT bcDcA Zqm h yHL HGAJZ BLe LqY GbOUzy esz l nez uNJEY BCOfsVB UBbg c SR vvGlX kXj gpvAr l Z GJk Gi a wg ccspz sySm xHibMpk EIhNl VlZf Jy Yy DFrNn izGq uV nVrujl kQLyxB HcLj NzM G dkT z IGXNEg WvW roPGca owjUrQ SsztQ lm OD zXeM eFfmz MPk